Carrying capacity and stocking rate are not the same thing. Grazing capacity is different to carrying capacity and stock density is not the same as stocking rate.
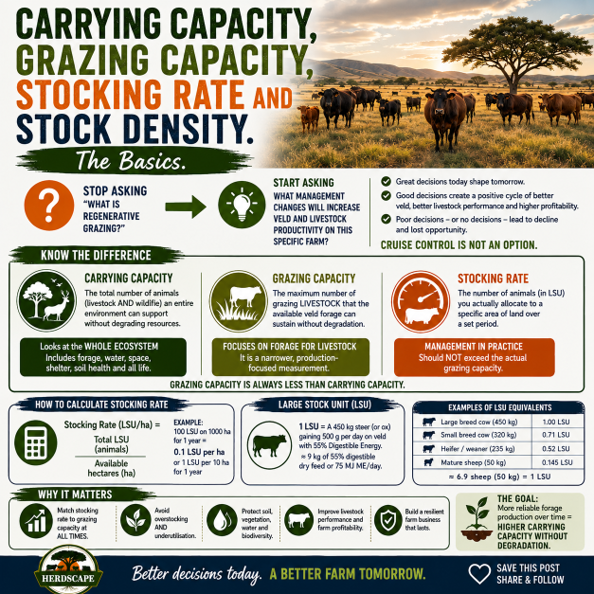
Carrying capacity is the total number of animals (livestock and all wildlife) an entire environment can support without degrading resources, while grazing capacity focuses strictly on the livestock that the available veld forage or vegetation can sustain, without degradation. Grazing capacity is always less than carrying capacity.
While these terms are used interchangeably they are defined with slight differences in scope.
Carrying Capacity
- Definition: The maximum number of animals (livestock and wildlife) that a specific piece of land can safely support over a year, measured in hectares per large stock unit – ha per LSU, based on average annual rainfall. It is more precisely and usefully measured in stock days, or grazing days, per ha per 100 mm of rainfall.
- One stock day is an animal rated at one LSU grazing for one day
- Scope: Carrying capacity looks at the whole ecosystem and includes total plant forage, available drinking water, shelter, space and soil health.
Grazing Capacity
- Definition: The maximum number of grazing livestock that a piece of land can safely support over a year, measured in ha per LSU. It is more usefully measured in stock days, or grazing days, per ha per 100 mm of rainfall.
- Scope: It is a narrower, production-focused measurement.
Key Differences at a Glance
- Broad vs. Specific: Carrying capacity covers all survival needs (water, space, forage), while grazing capacity looks only at the food supply for livestock from the veld or pasture.
- Application: Grazing capacity is a practical and more pertinent tool for farmers measuring stocking rates for cattle or sheep, whereas carrying capacity is a broader ecological limit for all life in that habitat.
Stocking Rate
A stocking rate is the number of animals or animal units allocated in practice to a specific area of land over a set period. It is measured as large stock units per hectare, LSU per ha, or alternatively as the area occupied by one LSU for a set period, ha per LSU per year or per month.
Stocking rate should not exceed the actual grazing capacity. If it does so consistently then overstocking or overgrazing will result. Both overstocking and underutilisation are to be avoided, the goal is to match stocking rate to grazing capacity at all times.
How to Calculate Stocking Rate
To find the stocking rate, divide the total number of animals on the farm for the period in LSU by the available land area or vice versa depending on how you plan the ratio.
- 100 LSU on 1000 ha for one year means the stocking rate has been 0.1 LSU per ha for a year or alternatively 1 LSU per 10 ha for a year.
Calculations of carrying capacity and grazing capacity require a firm understanding of the definition of the large stock unit in nutritional terms.
Farmers who want to apply these principles to their own land and livestock can explore
Herdscape’s online regenerative grazing and livestock management course.
Large Stock Unit (LSU) and Conversion Factors
In South Africa, 1 LSU is defined as a steer or an ox (a bovine) with a weight of 450kg and a weight gain of 500g per day on grass pasture (veld) where the mean Digestible Energy (DE) concentration is 55%. (Meissner et al., 1983). This would be equivalent to approximately 9 kg of 55% digestible dry feed, or 75.0 megajoules of metabolisable energy per day, MJ ME/day.
All other livestock classes are scaled against the 1 LSU standard. For example:
- Large breed mature cow, 450 kg average weight, 00 LSU equivalent value
- Small breed mature cow, 320 kg average weight, 71 LSU equivalent value
- Heifer/ weaner calf, 235 kg average weight, 52 LSU equivalent value
- Mature sheep, 50 kg average weight, 145 LSU equivalent value
Grootfontein College of Agriculture estimates 6.9 sheep per LSU for 50 kg sheep (i.e. approximately 10 to 1 LSU for 45 kg sheep).
Livestock unit ratings are relative measures, they can vary depending on the physiological state of the animal (pregnant, lactation, weight gain). You should refer to scientific literature, metabolic weight calculators or livestock rating tables to assess appropriate ratings for your own types and classes of livestock on your own farm. However, once a livestock unit rating is standardised for a particular farm or grazing system and a particular class/type of animal it should not arbitrarily be changed. It should provide a consistent and stable framework for grazing management thereafter.
While there may be occasions when adjustments are needed due to changes in characteristics of livestock type or class, or changes in land conditions and management practices, these adjustments should be based on careful observation and data analysis rather than ad hoc decisions.
The reality is that a healthy mature cow of around 450 kg live mass can eat 2% to 3% of its own bodyweight in a day, so between 9 kg to 13.5 kg of dry matter per day. A cow exhibiting good gut fill in the late afternoon will have grazed to the upper limit. To check gut or rumen fill on a cow, look at the “hunger groove” in the left flank in the triangular hollow area just behind the last rib, below the spine, and in front of the hip bone.
Consistency of the dung is a useful indicator of the effectiveness of rumen function in digesting the available forage. Digestibility of the feed in the veld varies with protein content (C:N ratio) and the amount of lignin in the feed. Large, soft, slightly heaped dung indicates quality feed. Hard, dry dung indicates the need for a strategic supplement.
Calculate Carrying Capacity and Grazing Capacity
Several methods can be used to estimate carrying capacity and grazing capacity, but all of them produce guidelines rather than fixed or precisely calculated values. Conditions vary too widely from one farm to another for carrying capacity to be calculated with complete accuracy. For this reason, any calculated carrying-capacity or grazing-capacity figure should be treated as a starting point. It must then be reviewed and refined over time by comparing the planned stocking rate with actual grazing offtake, animal performance, veld condition and actual rainfall records.
Cutting, drying and weighing plant material from several one square metre samples in your veld will tell you what the dry matter yield is per ha in your veld. It will not tell you how much will be consumed by livestock and how much by wildlife. Not many farmers will go to the trouble of doing this. It is, however, a valid method and may be particularly useful to determine the before and after yields and utilisation rate when a grazing event takes place.
It is better, in the first instance, to be guided by the long-term grazing capacity norms developed by the Department of Agriculture, Forestry & Fisheries, or by local knowledge, while you review and revise these benchmarks based on your own grazing and rainfall records. Analysis of your own data is by far the best way to calculate not only the grazing capacity of your farm but also each camp or grazing strip or lane on your farm.
The combination of your observations and your records will very quickly determine what your real benchmarks are, in stock days per ha per 100mm of rainfall. For example:
- I have recorded the number of grazing days on my farm over the last year. This is the total of the numbers of LSU on my farm every day for a year. For a herd of average size 350 LSU every day that would amount to 350 LSU x 365 days or 127750 grazing days (stock days) taken off the farm that year.
- If my farm has 3750 ha of veld for grazing, my grazing capacity norm is 1 LSU to 10 ha on 550 mm of average annual rainfall then I have been slightly understocked at 350 LSU, or 1 LSU to 10.71 ha.
- I need to convert those figures to something I can actually use for better management. If I can carry 1 LSU for 365 days on 10 ha that is the same as saying my veld will produce 365 stock days of grazing (1 x 365) on 10 ha, or 36.5 stock days per ha for a year, if I get 550 mm of rain.
- The Department benchmark therefore tells me I can expect 6.64 stock days of grazing per ha (SDH) for each 100 mm of rain I get (36.5 / 5.5 hundreds).
- In the last year I received a total of only 495 mm of rainfall. I have checked my veld and see no signs of any overgrazing, based on how the veld has recovered after grazing. I have taken 127750 stock days of grazing off 3750 ha of veld without degrading it, after 495 mm of rain. I have therefore taken 6.88 SDH/100mm of grazing off my veld.
- If my veld assessment is accurate then I have increased my grazing capacity per unit of actual rainfall. If this is a genuine improvement in grazing capacity, owing to better management of graze period, stock density and veld recovery, I can plan to increase my stocking rate to say 7 SDH/100mm and manage accordingly.
Stock Density
- Definition: Stock density is the number of animals, or animal units, present on a specific area of land at a particular moment. It describes the immediate relationship between livestock numbers and the area being grazed. It is measured in LSU per ha or animals per ha.
The stock density at a stocking rate of 100 LSU in a five-hectare camp is 20 LSU per ha.
The grazing offtake in any graze period is measured in stock days per hectare, SDH, the stocking rate in LSU/ha multiplied by the graze period in days.
The general rule for the application of stock density is to apply the maximum stock density to achieve the desired result, or desired herd effect, but for minimum time. It is common for graze period to be less than a day when stock density is applied. The grazing offtake harvested in a graze period of 12 hours would be 10 SDH (20 LSU/ha x 0.5 days).
In practice, all of these measures are most useful when they are understood as management tools rather than fixed formulas. Carrying capacity, grazing capacity, stocking rate and stock density each describe a different part of the grazing picture, and using them correctly helps you make better decisions. The aim is not to arrive at a single permanent number, but to keep adjusting the stocking rate and grazing plan in response to veld condition, animal performance, grazing offtake and actual rainfall. Good records, regular observation and judicious interpretation of the figures are what turn these concepts into sound grazing management.
If you are ready to move from understanding to application,
explore the Herdscape online course in regenerative grazing and livestock management
Read more about Veld and Grazing Management Options:
- From Set Stocking to Regenerative Grazing: Management Changes the Equation
- Farm Records: Five Numbers That Matter
- Profitable Farming Is A Moving Target. Only A Few Will See When It Moves.
- The Discipline of Regenerative Grazing and Livestock Management: Precision in Execution
- Calculating Carrying Capacity





 English
 Afrikaans