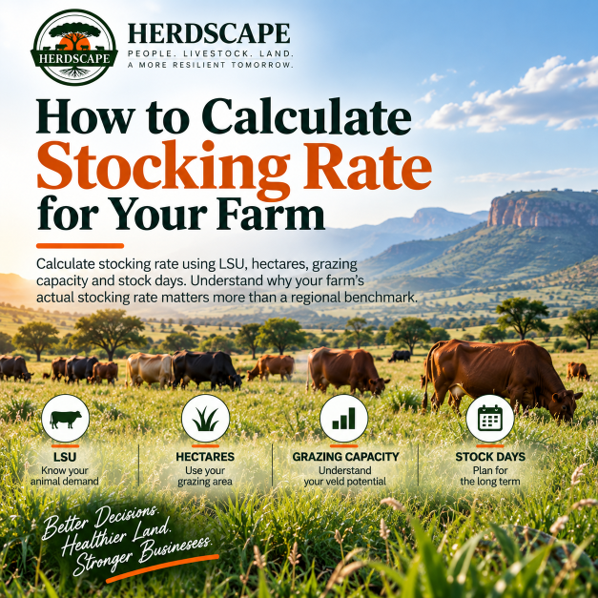
Calculate stocking rate using LSU, hectares, grazing capacity and stock days. Understand why your farm’s actual stocking rate matters more than a regional benchmark.
Stocking rate sounds like a simple number but it is not always a simple decision to choose what it is. Knowing how to calculate the number is only the beginning, the more important question for a livestock producer is:
What does this stocking rate mean for my veld, my animals and for my business?
A stocking rate calculated from a formula can be mathematically correct and still be a poor management decision if it ignores actual rainfall, veld condition, forage availability, animal demand and what has happened on the farm in the past.
That distinction matters.
Herdscape’s approach is to use stocking rate as a management measurement, not as a number to put on your farm and then to forget about. Deciding on a stocking rate is one of the most important grazing decisions you will make. If it is not accurate and is not monitored it will lead either to veld degradation or to lost production opportunities.
What is Stocking Rate?
Stocking rate is the number of livestock or livestock units allocated to a specified area over a defined period. In South Africa it is most often expressed as the number of hectares of grazing land needed on your farm per standard animal unit, per year. It is not the same for every farm and it needs to account for both animal numbers and animal class. The standard animal unit commonly used to standardise different classes of livestock is the Large Stock Unit (LSU).
The standard LSU defines how much feed, in energy and dry matter terms, a healthy animal unit will eat in one day. Simply put, one unit is equivalent to a 450 kg animal gaining 500 g of liveweight per day on veld.
Stocking rate can be expressed in several ways, including:
- LSU per ha
- Ha per LSU
- LSU per year
- Ha per LSU per year
If the number of animals grazing on your farm last year, say 200 LSU on 1200 ha of grazing, for example, then your stocking rate has been 1 LSU per 6 ha per year.
Stocking Rate Is Not Grazing Capacity
This is one of the most important concepts in South African grazing management.
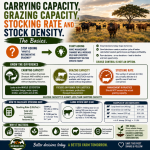
Stocking rate describes in LSU what you are actually carrying, or what you intend to carry. Grazing capacity describes the amount of forage that the veld can safely provide to your livestock without degrading. The management objective is to keep animal demand and the productive capacity of the veld in balance.
The two numbers therefore answer different questions.
- Stocking rate: What am I carrying?
- Grazing capacity: What can the veld provide for my livestock?
The farm’s Carrying Capacity tells you how much of your veld production can safely be used for livestock production while also leaving enough for everything else that lives in or improves biodiversity in the veld ecosystem. This may come from official grazing-capacity guidelines published by the Department of Agriculture, an agricultural adviser, local veld assessments, reliable farm records or local knowledge. Carrying capacity is defined in terms of long-term average annual rainfall, but it is not fixed in practice. It will vary with actual rainfall and with management.
The portion of carrying capacity used by your livestock is the grazing capacity of the farm. It is the amount of forage in the veld used only by your livestock at the correct stocking rate. Grazing capacity is always less than the carrying capacity of your land.
The purpose of making these calculations is not to arrive at some theoretical number but to create a practical guide based on actual veld production and actual stocking rate, to maintain the balance between the two. Better decisions will follow. You will be able to ensure you have enough animals to make productive use of the forage available but not so many that the veld is degraded and loses its ability to regenerate and improve.
Farmers who want to apply these principles to their own land and livestock can explore
Herdscape’s online regenerative grazing and livestock management course.
Step-by-Step Stocking-Rate Calculation
The simplest way to calculate your initial stocking rate is to work with the area of land you have available for grazing, with the grazing capacity of your land and to convert your livestock into LSU units. You can then compare the number of animals you plan to run with what the veld can safely carry.
- Measure the usable grazing area.
- Find your grazing capacity benchmark. Use the best available ha per LSU per year figure for your area, veld type and veld condition.
- Calculate the total LSU the land can carry by dividing the usable grazing area by the grazing-capacity figure: grazing capacity limit = (usable hectares / ha per LSU), LSU.
- Convert your livestock to LSU to show your current stocking rate in LSU.
- Compare veld supply with current livestock demand.
- Adjust for current rainfall and ecosystem health.
For example:
I have 1000 ha of veld for grazing, my grazing capacity is 1 LSU per 6 ha per year. I calculate, therefore, that I can carry 167 LSU on my farm i.e.:
1000 ha / 6 ha per LSU = 167 LSU.
Unless my observations of veld and animal condition tell me otherwise:
- If I have 150 LSU currently then my farm is understocked.
- If I have 190 LSU my farm is overstocked.
Stock Days Can Tell You More
One of the most useful ways to understand grazing capacity is through stock days.
- One stock day represents 1 LSU grazing for 1 day.
- If you have 300 LSU grazing for 10 days, you have used 3 000 stock days of grazing.
You could calculate how much dry matter that is, or the amount of megajoules of energy consumed by your animals, but there really is no need. Healthy animals eat what they can, if veld quality and quantity allows.
You can create a much more useful picture of what your veld actually produces, rather than simply repeating a historical hectares-per-LSU number, by relating stock days of grazing to hectares and to actual rainfall as follows:
Assume you have 1,000 hectares of usable grazing land and the local grazing capacity benchmark is 6 ha/LSU per year, given long-term average annual rainfall. This means that 6 ha of grazing area will, on average, sustain 1 LSU for 365 days. One hectare will thus sustain 1 LSU for 61 grazing days, or 61 stock days. Hence the stocking rate can be written 61 stock days of grazing per ha, abbreviated to 61 sdh. If the long-term average annual rainfall is 600 mm and you actually get that much rain then you can expect 61 sdh of grazing.
The estimated grazing capacity required for 167 LSU for a year is therefore:
- 167 LSU x 365 days = 60955 stock days (sd) of grazing for the herd per year
With average rainfall and good veld the farm will carry 167 LSU. If you plan to run 150 mature cattle at roughly 1 LSU each, the stocking rate is within the benchmark but the veld will be underutilised. If you plan to run 190 LSU, the farm is likely to be overstocked unless there is additional feed or rain and exceptional veld conditions, or a grazing period of less than a year.
Adjusting for Rainfall and Veld Condition
The calculated stocking rate should be treated as a planning benchmark, not a fixed instruction. It is not a law. A traditional stocking-rate benchmark might say, “10 ha per LSU per year” and that is useful information but it should not automatically be interpreted as:
“My farm can carry exactly one LSU per 10 hectares, regardless.”
Benchmarks are based on assumptions about rainfall, vegetation and veld condition but your farm is not an average farm, your rainfall is seldom average rainfall, your veld condition is not a regional average and your management is not the same as everybody else’s.
This is why Herdscape argues that a long-term benchmark should only be used as a starting point. Refine the benchmark thereafter using actual farm records of rainfall and grazing days and confirm by monitoring and observing your animal performance and your veld condition.
Stocking rate becomes a dependable management tool when you calculate it from your own records and compare what actually happens against your benchmark. You develop something more valuable than a ‘published’ theoretical stocking rate when you develop your farm’s own evidence base. Keep these records:
- rainfall
- number of LSU
- grazing days
- camps grazed
- veld condition
- residual forage
- animal performance
- changes in stock numbers.
Actual grazing capacity is strongly correlated to actual rainfall so adjust it accordingly. If you get less than average rainfall then expect proportionally less grazing capacity on the farm. Grazing capacity will increase with higher-than-average rainfall.
(See the next Chewing the Cud article “What Is the Right Stocking Rate for Your Farm?” for how your rainfall records will guide your decisions).
What Happens When Stocking Rate Is Too High?
If livestock demand exceeds what the veld can provide the consequence will be a degradation of the veld. South African research demonstrates why this cannot be treated as a theoretical issue. In one Free State study, severely overstocked farms were shown to have significantly higher animal mortality than correctly stocked farms. Livestock production suffers in both the short and the long term if the veld is overstocked.
The answer is not simply to reduce the number of animals. You may need to do so in the short term, but the better question is:
Why is the farm producing less forage than it could?
Herdscape’s approach is that carrying capacity can be improved by deliberately managing for regeneration but the actual stocking rate must remain responsive to the productive capacity of the veld at all times. The goal is not “more animals at any cost”, the goal is:
More productive livestock from a more productive veld.
This moves the discussion from simply managing animal numbers to managing the productive capacity of the veld as well. A higher stocking rate should never be treated as an objective in itself, there are just too many variables for that to be a sound decision:
- Rainfall changes.
- Veld condition changes.
- Animal requirements change.
- Markets change.
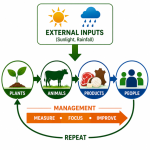
Good grazing management is an ongoing process of:
Planning → Measuring → Observing → Deciding → Acting → Adapting → Planning …..
Formulae to Remember
Stocking rate in LSU = usable grazing hectares / grazing capacity in ha/LSU
(= the maximum number of LSU the farm can carry every day for a year).
Planned stocking rate in LSU per ha = total livestock LSU / usable grazing hectares
Planned stocking rate in ha per LSU = usable grazing hectares / total livestock LSU
Do not rely solely on regional averages, knowing the formulae is useful but understanding what the numbers mean for your own farm is considerably more useful.
Herdscape’s Regenerative Grazing and Livestock Management Course covers carrying capacity, grazing capacity, stocking rate, stock density, grazing and rainfall records and the practical decision-making framework that connects them all.
If you are ready to move from understanding to application,
explore the Herdscape online course in regenerative grazing and livestock management
Read more about Veld and Grazing Management Options:



 English
 Afrikaans